At a glance
In 2019, the Centers for Disease Control and Prevention (CDC) and the Agency for Toxic Substances and Disease Registry (ATSDR) started exposure assessments (EAs) in communities near current or former military bases known to have had per- and polyfluoroalkyl substances (PFAS) in their drinking water.

Information to protect our communities

Individuals who participated in the EAs provided blood and urine samples to CDC/ATSDR for analysis. We sent letters to participants with their individual lab results. See the sample letter of test results.
Additional information is also being reviewed to better understand the community's exposure. This includes age and location. Once our full analysis is complete, CDC/ATSDR will host an in-person community meeting to share our findings and recommendations.
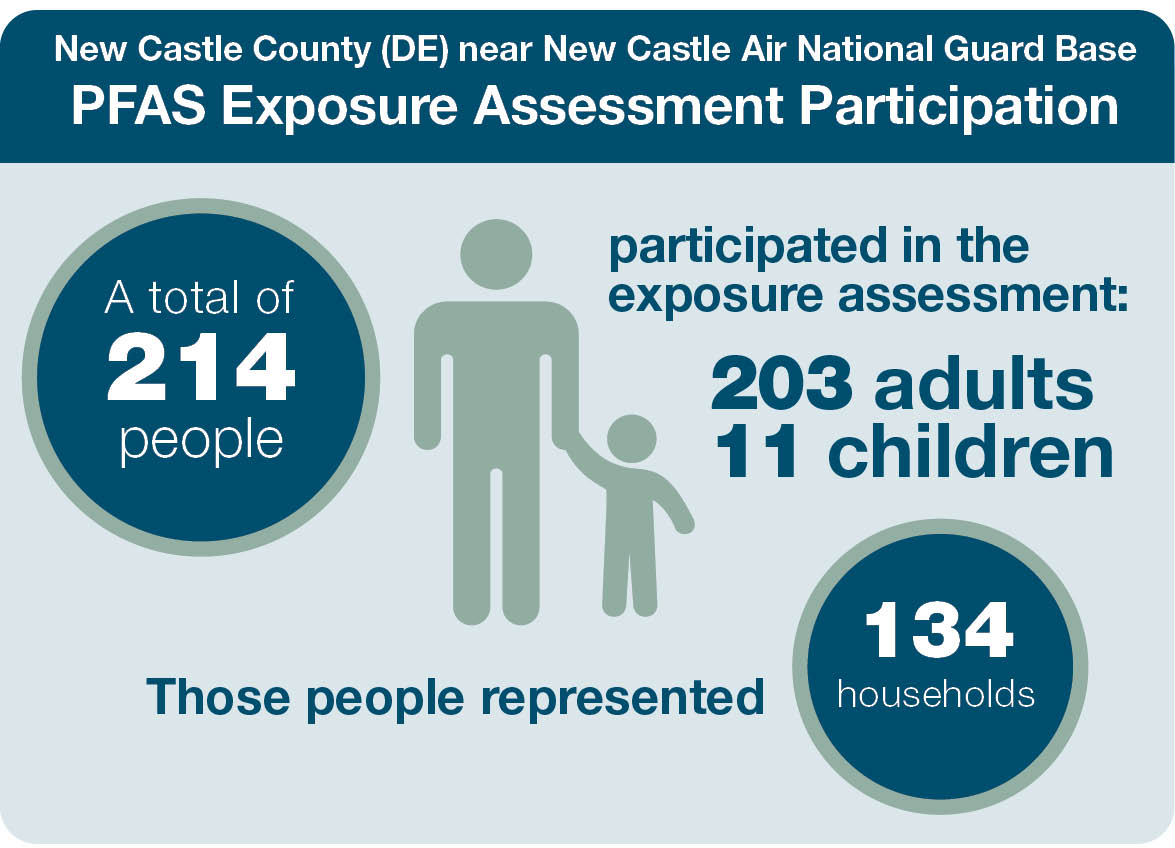
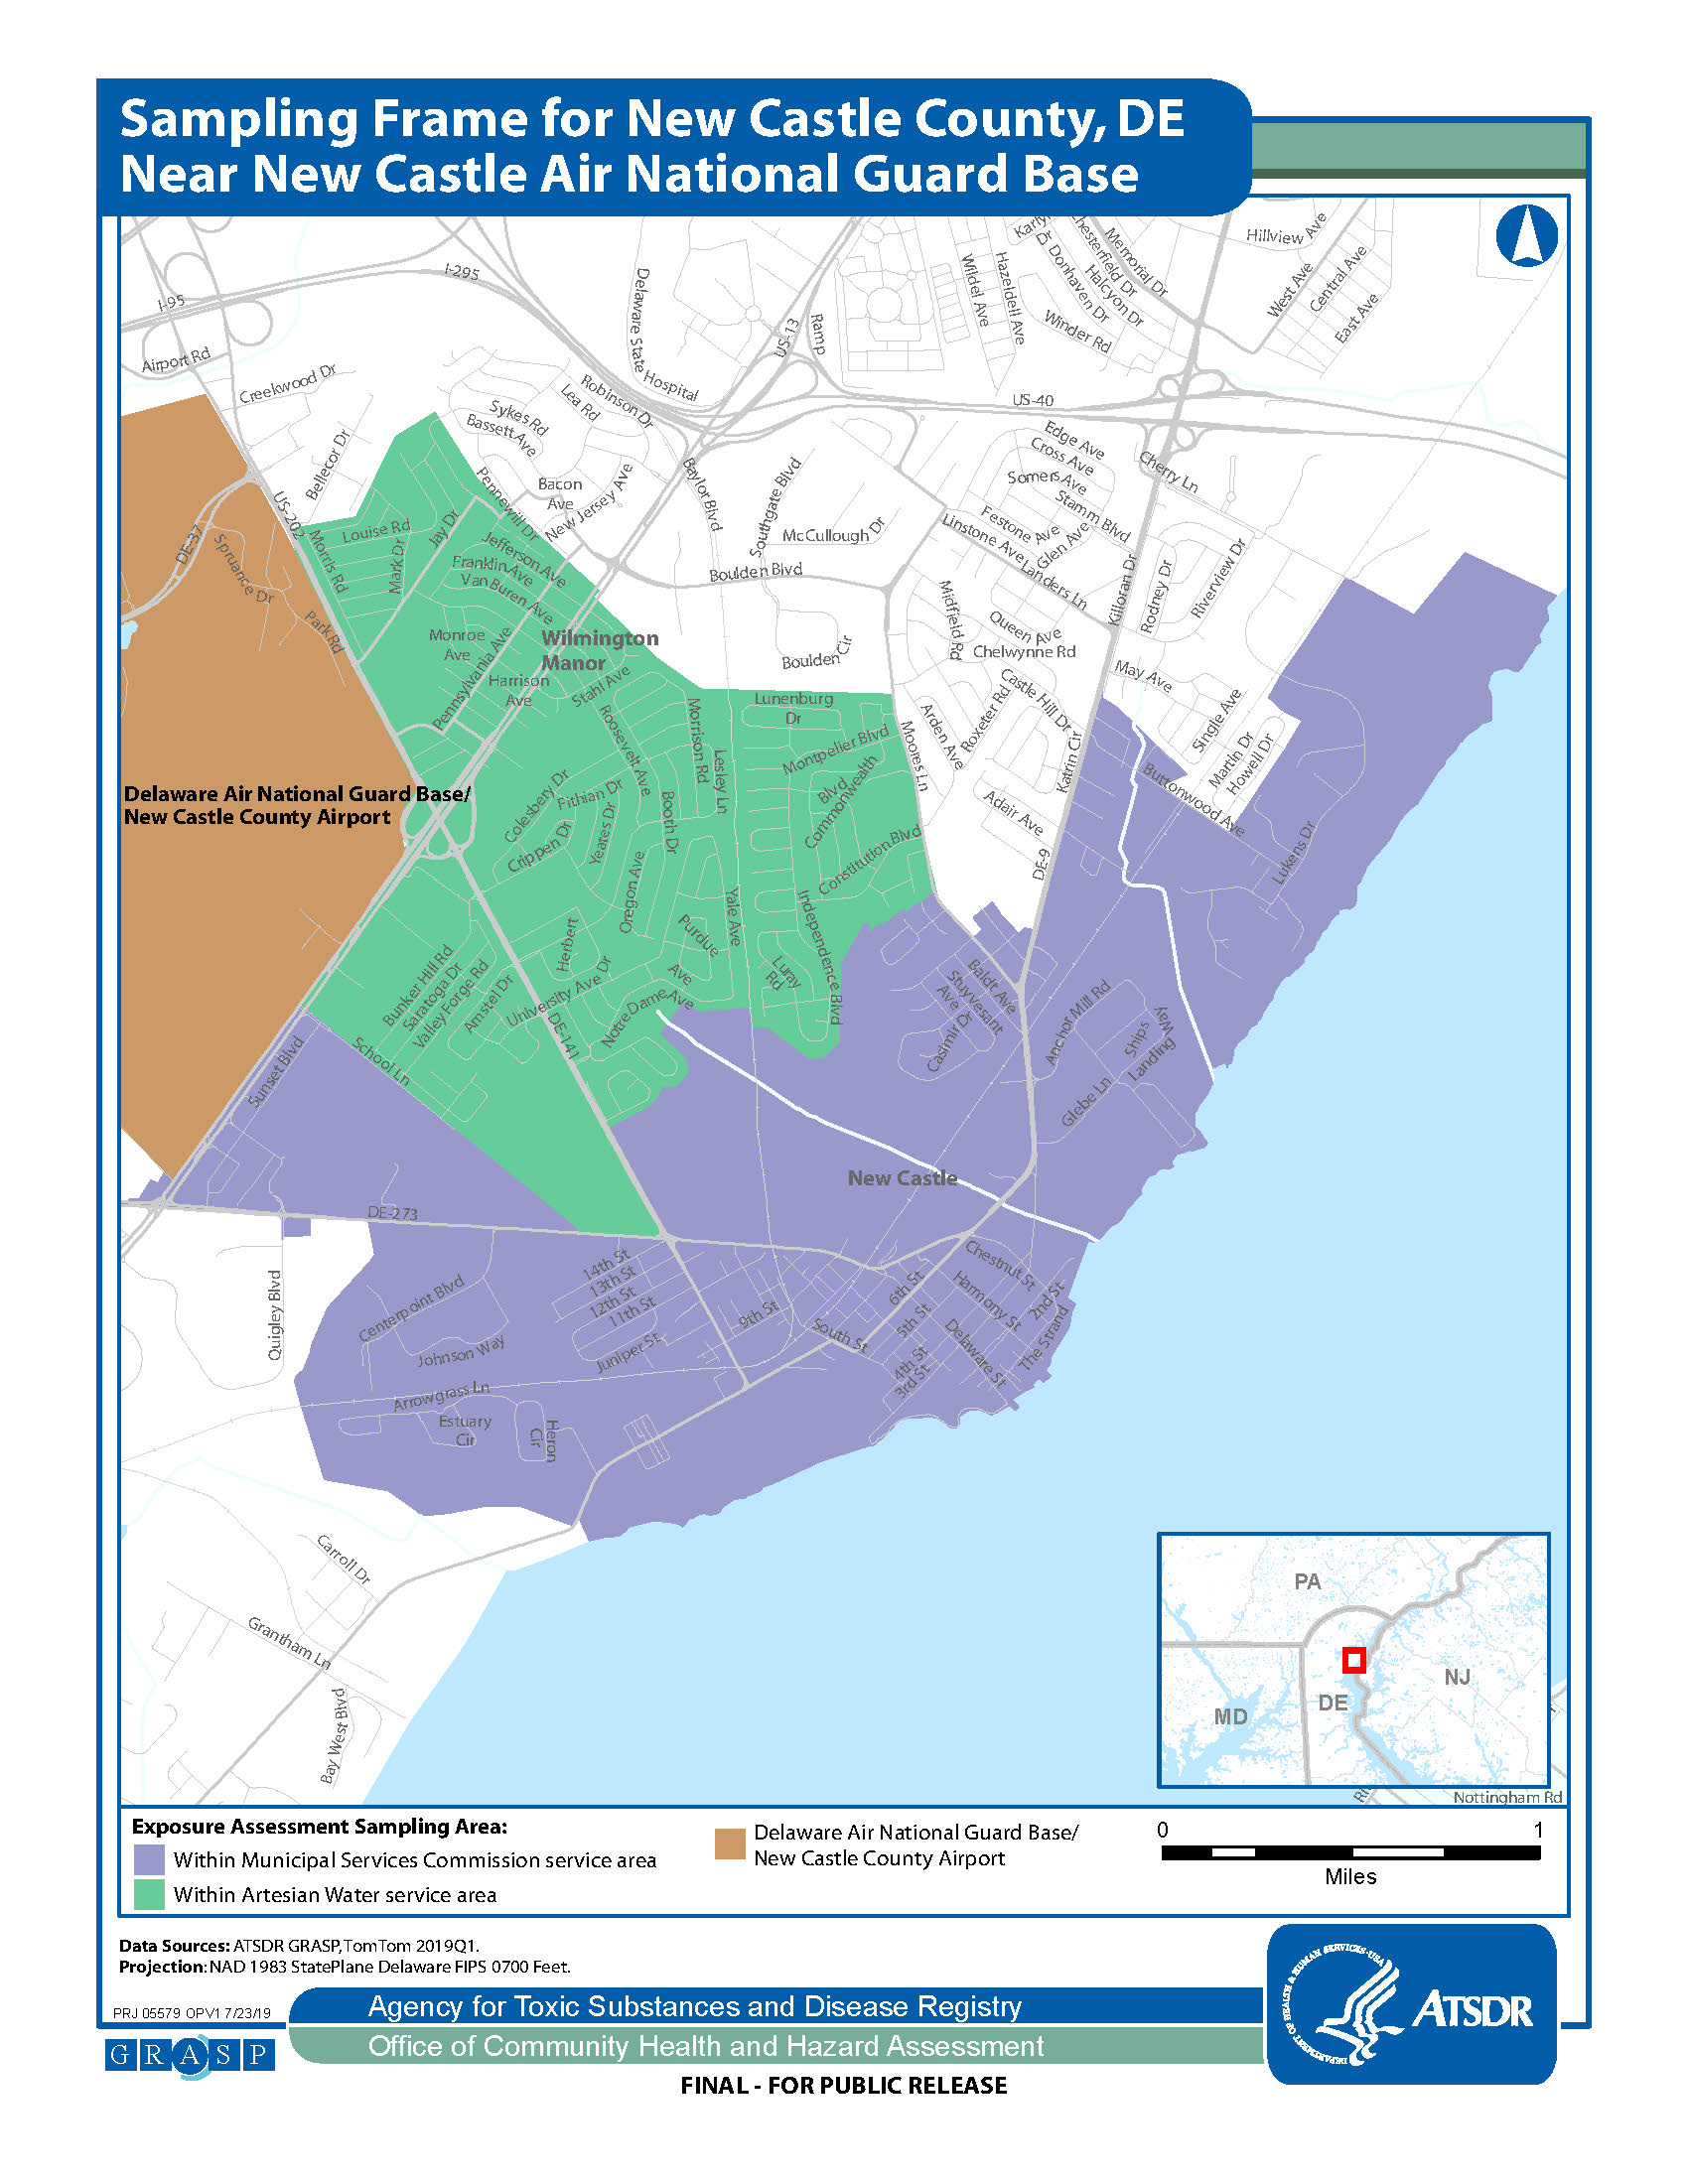
The New Castle County, DE, site focused on an area near the New Castle Air National Guard Base (ANG). Participants were selected at random. This let us estimate exposure for other community members in this area, even those who were not tested. For more information, refer to the map of the sampling area.

PFAS and NHANES
Did you know?
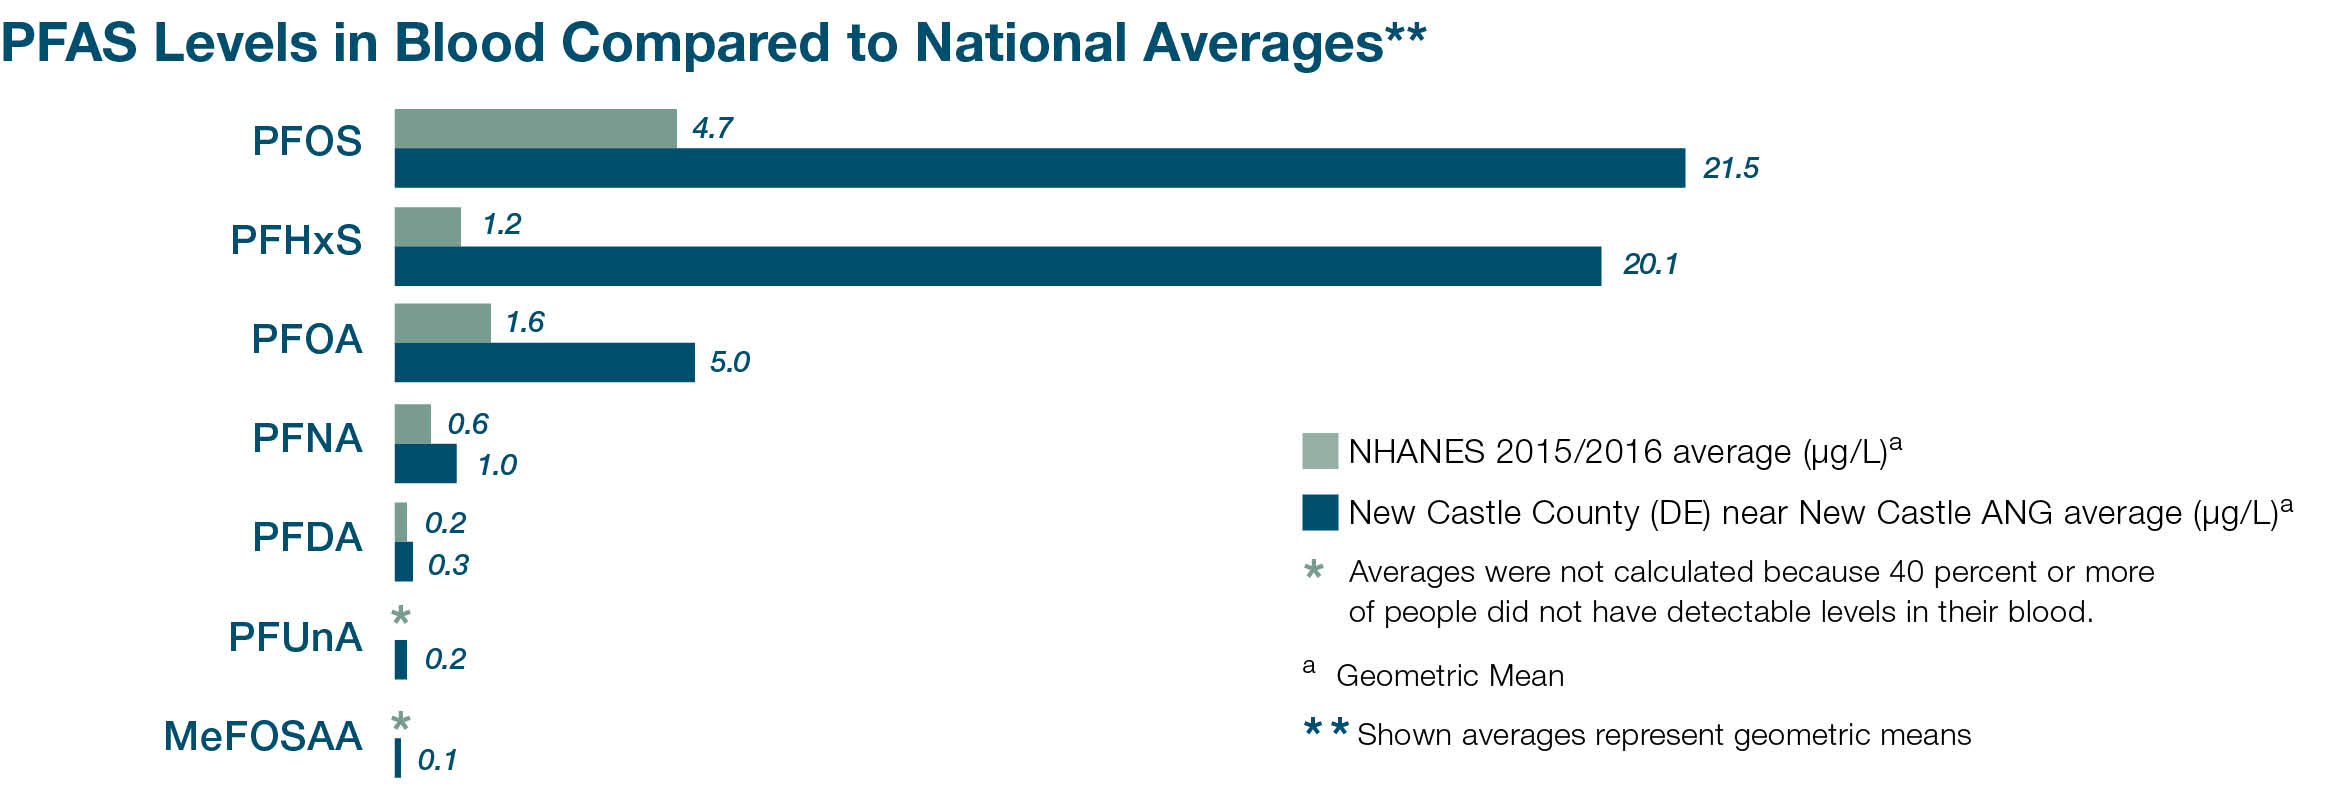
The lab tested participants' blood for seven different PFAS. PFAS levels are measured in micrograms per liter (µg/L).
CDC/ATSDR compared blood levels of PFAS in participants across the community to the national average levels in the U.S. population. Three PFAS (PFHxS, PFOA, and PFOS) were detected above national averages. The levels of PFNA, PFDA, MeFOSAA, and PFUnA were similar to national averages.
PFAS levels in blood compared to national averages**


PFAS levels in blood compared to other studies**


Other PFAS levels
Urine
All participants provided a urine sample; some of the samples were analyzed. Only one PFAS (PFBA) was detected at low concentrations in 59% of the samples collected. This level falls just above the non-detect level.
Tap water
CDC/ATSDR collected and tested tap water samples from some participating households. PFAS levels for all 13 samples were below all federal and applicable state guidelines for PFAS in drinking water.
Local authorities in New Castle have taken action to reduce levels of PFAS in drinking water. The public drinking water supplies in and near New Castle currently meet all federal guidelines for PFAS. ATSDR does not recommend community members use alternative sources of water.
Dust
CDC/ATSDR collected and analyzed indoor dust samples from 13 participating households. CDC/ATSDR is evaluating the results and will have more information in the final report.
About the results
For more information
Visit www.atsdr.cdc.gov/pfas or contact:
Michael Byrns, PhD
Regional Director
404 - 498 -1681 | ab79@cdc.gov
CDC/ATSDR is evaluating data collected from the PFAS EA to better understand exposure in the community. This measures PFAS levels in people's bodies but is unable to identify health effects associated with these levels of exposure. We are working to better understand health effects from PFAS exposure through the Multi-site Health Study.
We are also reaching out to doctors, nurses, and other health care providers in your area to provide PFAS information.
- https://www.tandfoline.com/doi/pdf/10.1080/15426110308984859?needAccess=true
- CDC/ATSDR 2019
- https://health.pa.gov/topics/Documents/Environmental%20Health/PEATT%20Pilot%20Project%20Final%20Report%20April%2029%202019.pdf
- https://www.atsdr.cdc.gov/HAC/pha/Decatur/Perfluorochemical_Serum%20Sampling.pdf
- https://ehp.niehs.nih.gov/doi/pdf/10.1289/ehp.0800379
- https://dhhs.nh.gov/dphs/documents/pease-pfc-blood-testing.pdf
- https://www.health.ny.gov/environmental/investigations/drinkingwaterresponse/docs/westhampton_quogue_group_level_blood_testing
- https://www.cdc.gov/exposurereport/pdf/FourthReport_UpdatedTables_Volume1_Jan2019-508.pdf

