At a glance
Find the answers to frequently asked questions about the Environmental Justice Index.

General
How can individuals, community-based organizations, scientists, researchers, and public health officials at local, state, and federal levels use the EJI?
The EJI can be used to:
- Identify and prioritize areas that may require special attention or additional action to improve health and health equity
- Educate and inform the public about their community
- Analyze the unique, local factors driving cumulative impacts on health to inform policy and decision-making
- Establish meaningful goals and measure progress towards environmental justice and health equity
Additionally, the EJI can be used to identify communities highly impacted by environmental burdens, so those communities can be prioritized for action. For example, public health officials could use the EJI to prioritize communities with high EJI scores for public health intervention. See the EJI resource called "Using the Environmental Justice Index: A Resource for State, Local, and Tribal Government" for more examples of how the EJI can be used by state, local, and Tribal governments.
Another way that the EJI can be used is to generate hypotheses. For example, scientists and researchers might use the EJI to determine if social vulnerabilities or environmental burdens are associated with overall life expectancy at the census tract level. Please see the EJI Technical Documentation for some important considerations and limitations of using the EJI for secondary analysis.
Lastly, the EJI can also be used to help inspire action at the local level. For example, community organizations and individuals might use the EJI to educate others in their community, inspire local action, develop grant applications, and complement local knowledge and expertise.
What indicators are included in the overall EJI Rank?
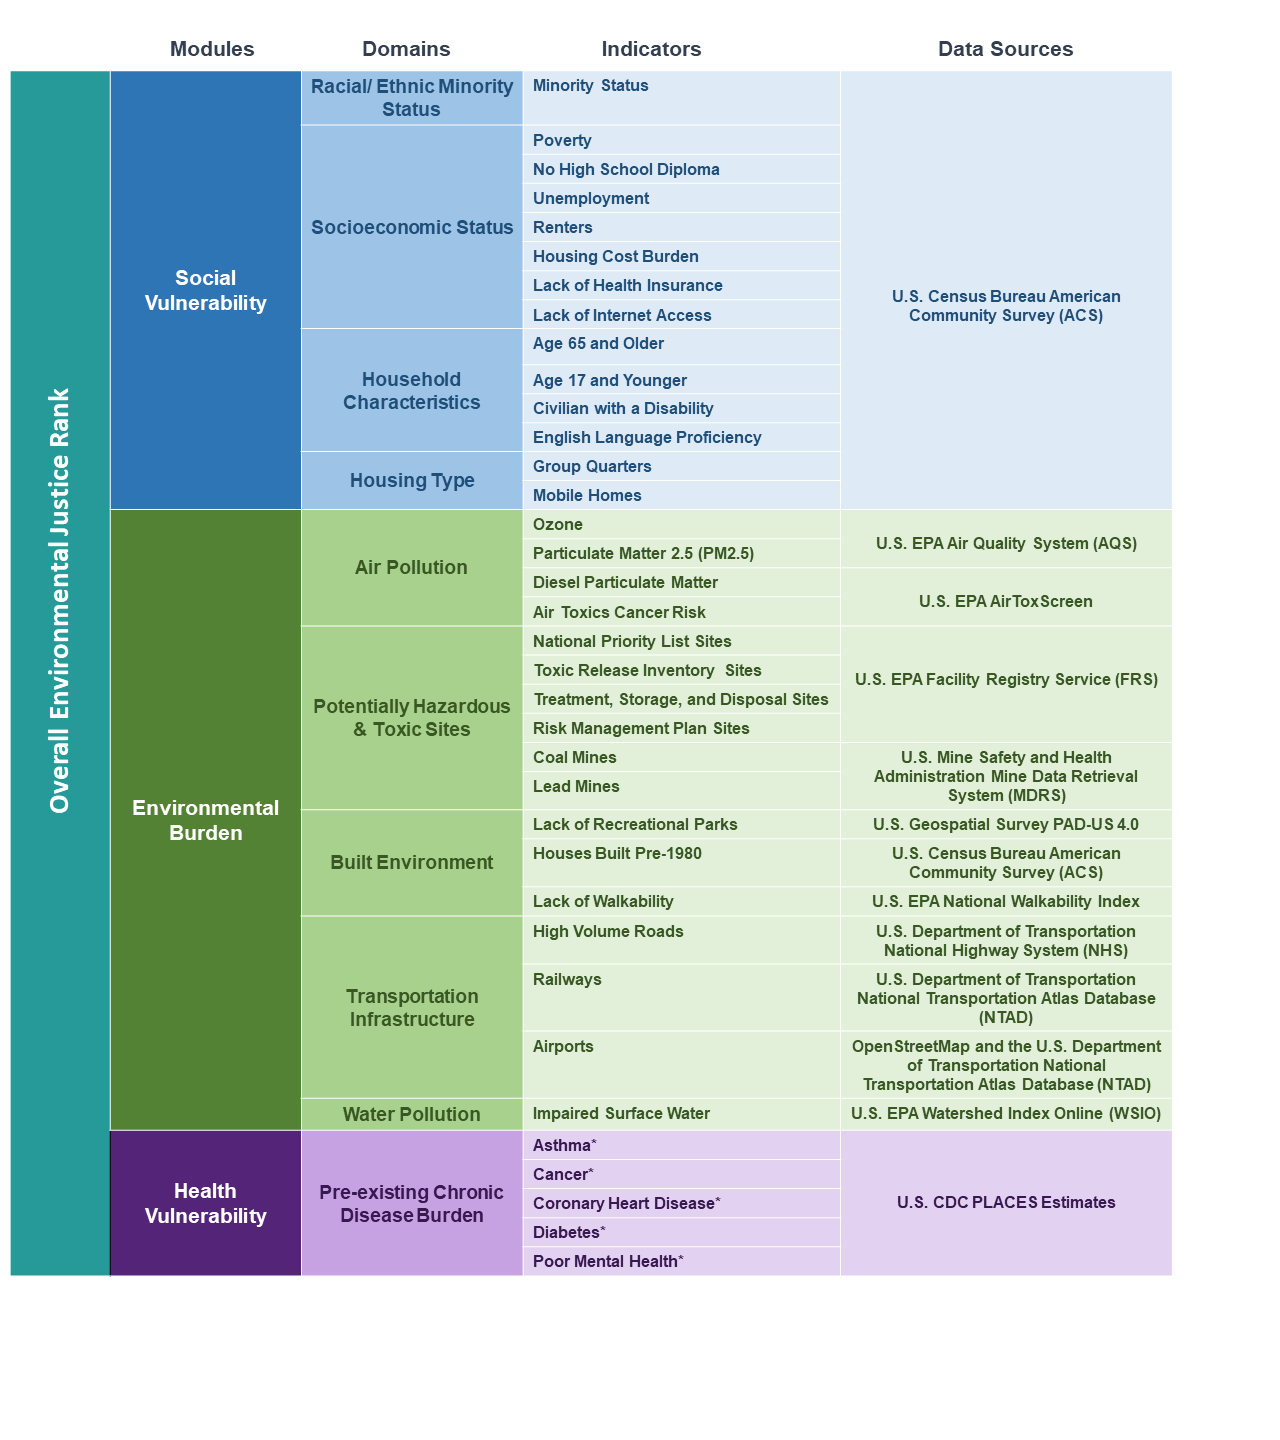
The graphic below shows the modules, domains, and indicators included in the EJI.
Environmental Justice Index indicators

*Health vulnerability measures are marked with asterisks as they are calculated differently than other indicators. While most indicators can have a range of values, the health vulnerability indicators only represent whether or not a given census tract experiences a high estimated prevalence of disease. See the EJI Technical Documentation for more information on indicators and index scoring.
EJI Indicators
Text-Only Version
Social Vulnerability Module
- Racial/Ethnic Minority Status
- Minority Status
- Minority Status
- Socioeconomic Status
- Poverty
- No High School Diploma
- Unemployment
- Renters
- Housing Cost Burden
- Lack of Health Insurance
- Lack of Internet Access
- Poverty
- Household Characteristics
- Age 65 and Older
- Age 17 and Younger
- Civilian with a Disability
- English Language Proficiency
- Age 65 and Older
- Housing Type
- Group Quarters
- Mobile Homes
- Group Quarters
Environmental Burden Module
- Air Pollution
- Ozone
- Particulate Matter 2.5 (PM2.5)
- Diesel Particulate Matter
- Air Toxics Cancer Risk
- Ozone
- Potentially Hazardous and Toxic Sites
- National Priority List Sites
- Toxic Release Inventory Sites
- Treatment, Storage, and Disposal Sites
- Risk Management Plan Sites
- Coal Mines
- Lead Mines
- National Priority List Sites
- Built Environment
- Lack of Recreational Parks
- Houses Built Pre-1980
- Lack of Walkability
- Lack of Recreational Parks
- Transportation Infrastructure
- High Volume Roads
- Railways
- Airports
- High Volume Roads
- Water Pollution
- Impaired Surface Water
- Impaired Surface Water
Health Vulnerability Module
- Pre-existing Chronic Disease Burden
- Asthma*
- Cancer*
- Coronary Heart Disease*
- Diabetes*
- Poor Mental Health*
- Asthma*
Are climate indicators included in the EJI?
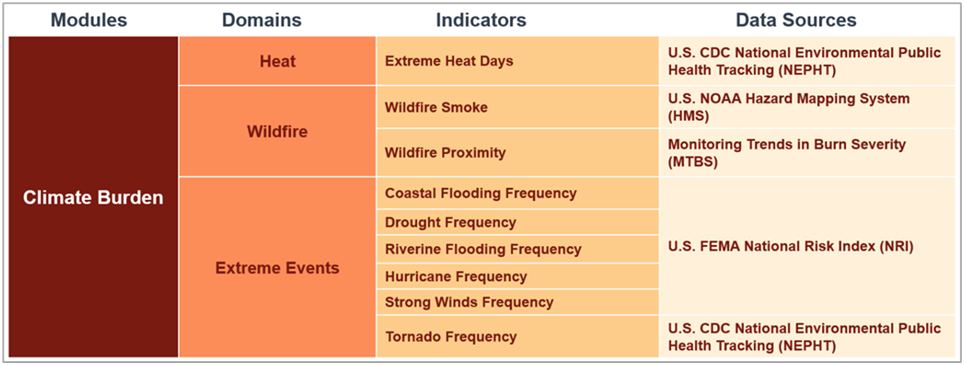
The 2024 EJI includes a supplementary EJI + Climate Burden rank that integrates the new EJI Climate Burden Module. The EJI Climate Burden Module includes 9 indicators related to heat, wildfire, and extreme events. The Climate Burden Module is intended to capture cumulative climate-related environmental burdens that impact the health and well-being of U.S. communities. See the EJI Technical Documentation for more information on the Climate Burden Module and how it is integrated with the base EJI to create the EJI + Climate Burden rank.
Why are climate indicators not included in the overall EJI rank?
The Climate Burden Module and EJI + Climate Burden rank are additions to the base EJI, which combines ranks for the Social Vulnerability Module, Environmental Burden Module, and Health Vulnerability Module. The calculation of the base EJI was not changed, to make it easier to compare base EJI releases and to help clarify which EJI datasets are comparable. The EJI + Climate Burden rank is part of the 2024 EJI database and is viewable on the EJI Explorer.

What indicators are included in the EJI Climate Burden Module?
The graphic below shows the domains and indicators included in the EJI Climate Burden Module.

Text-Only Version
Climate Burden Module
- Heat
- Extreme Heat Days
- Extreme Heat Days
- Wildfire
- Wildfire Smoke
- Wildfire Proximity
- Wildfire Smoke
- Extreme Events
- Coastal Flooding Frequency
- Drought Frequency
- Riverine Flooding Frequency
- Hurricane Frequency
- Strong Winds Frequency
- Tornado Frequency
- Coastal Flooding Frequency
How often will the EJI be updated?
The EJI is updated about every two years, based on the update schedules of the underlying data sources. Delays in receiving updated data from the original data sources may affect the timeline of future EJI releases.
What is the suggested citation for the EJI?
Centers for Disease Control and Prevention and Agency for Toxic Substances Disease Registry. [Year] Environmental Justice Index. Accessed [Date]. https://atsdr.cdc.gov/place-health/php/eji/index.html
What are distributive and procedural environmental justice?
Distributive environmental justice focuses on the equitable distribution of environmental benefits and burdens among different populations. Procedural environmental justice emphasizes the involvement of all communities, especially marginalized and disadvantaged groups, in environmental decision-making processes.
Methodology
What is the EJI framework and how are rankings calculated based on the various indicators?
The EJI framework includes three modules that are designed to assess and quantify environmental justice disparities across various communities. These modules include the Social Vulnerability Module (SVM), the Environmental Burden Module (EBM), and the Health Vulnerability Module (HVM), with each module focusing on specific indicators related to socioeconomic factors, environmental conditions, and health outcomes respectively.
For detailed information regarding EJI methodology and calculations, please refer to the EJI Technical Documentation.
How were the EJI indicators selected?
EJI indicators were selected based on a thorough literature review conducted by the EJI research team. This included a scoping review of the environmental justice literature, as well as a review of a number of existing environmental justice mapping tools. Indicators also needed to pass a series of global and module-specific criteria for inclusion in the EJI. Details on indicator selection and evaluation can be found in the EJI Technical Documentation.
Where can users learn more about the study methods and read about validation?
Detailed information on the development of the EJI can be found in the EJI Technical Documentation. Detailed information on statistical validation is forthcoming.
Where can users find more information about each indicator?
Definitions for each indicator can be found on the EJI Indicators webpage. Additional information about how each indicator was selected and created can be found in the EJI Technical Documentation.
Are EJI modules or indicators weighted? Are some factors considered more significant than others?
EJI modules and indicators are weighted equally, as the EJI is national in scope and the importance of specific factors in causing environmental justice disparities may vary by community. Local expertise is essential for identifying environmental justice issues at the community level and determining which indicators are the most appropriate to weight. Users can weight and customize the EJI data depending on community needs.
Where are the ranks for U.S. territories, Alaska, and Hawaii?
The EJI does not currently include ranks for U.S. territories, Alaska, or Hawaii, as data for some key environmental indicators (i.e., air and water pollution), are not available for these areas. The EJI team recognizes the significance of including U.S. territories, Alaska, and Hawaii in the EJI and is actively exploring ways to overcome data gaps to ensure their inclusion in future releases. The team also acknowledges the unique environmental challenges faced by these communities and is committed to addressing their specific needs in the EJI as data becomes available.
What is a "High Prevalence Flag" and how is this calculated?
The PLACES estimates used in the Health Vulnerability Module are based on survey data collected as part of the CDC's Behavioral Risk Factor Surveillance System (BRFSS) and calculated using a method known as small area estimation (SAE), which incorporates demographic data, including data on age, race/ ethnicity, education, and poverty. As these demographic data are used to produce each estimate, directly combining these estimates would lead to potential double-counting of demographic factors. To avoid this, health indicators are incorporated into the EJI by using the estimates to flag census tracts with disease prevalence estimates in the top tertile (33.33%) of all census tracts included in the EJI. This means that "flagged" tracts are those where a condition such as asthma, heart disease, or diabetes was more common in the population than in two-thirds of all other tracts nationwide.
Using the data
How can the EJI percentile ranking for a census tract be interpreted?
A percentile ranking represents the proportion of census tracts (or communities) that may experience more or less severe cumulative impacts from environmental burdens than the community of interest. For example, a EJI ranking of 0.75 signifies that 75% of tracts in the nation likely experience less severe cumulative impacts from environmental burdens than the tract of interest, and that 25% of tracts in the nation likely experience more severe cumulative impacts from environmental burdens.
How can the EJI be downloaded?
Users can easily access census tract level EJI datasets on the EJI Data Download website, for a specific state or nationally. The EJI data can be downloaded in either GIS-friendly geodatabase files, an Excel spreadsheet, or in a CSV data table for personal analysis. Additionally, a link to the latest version of the EJI Data Dictionary is provided on the website as a reference to help users understand the included data.
Is the EJI available at the ZIP code or ZIP Code Tabulation Areas (ZCTA) level?
The EJI is only available at the census tract level, as the census tract is the smallest unit of geography for which national environmental, social, and health data are consistently available.
Many EJI indicators are not available at the ZIP code level and there are important considerations to keep in mind when working with ZIP code level data. First, ZIP codes represent postal delivery routes, and their borders are subject to change by the U.S. Postal Service. As such, ZIP codes are not designed to be used when trying to easily compare data over time. While ZIP Code Tabulation Areas (ZCTA's) are relatively stable representations of ZIP codes for a snapshot in time, they are also subject to change and are not as useful for comparing data across periods of time as census tracts are. Additionally, environmental justice issues can be very localized and displaying EJI scores using ZIP codes or ZCTAs could be misleading, as these units may mask important neighborhood-level variations.
Can the data be aggregated or averaged to estimate scores for a group of areas such as counties?
Although it is mathematically possible to aggregate or average the data to estimate scores for specific areas, it is not recommended. Aggregation introduces unmeasurable error and could misrepresent neighborhood-level variation in social, environmental, and health conditions.
Using the EJI Social-Environmental Ranking (EJI SER)
What is the EJI Social-Environmental Ranking (SER)?
The EJI Social-Environmental Ranking (SER) represents a measure of distributive and procedural environmental justice factors that may influence human health and well-being. Distributive justice seeks to address place-based disparities in exposure to environmental hazards and procedural justice seeks the equitable involvement of all people in environmental decision-making.
The EJI SER is more suitable than the full EJI for research and secondary analyses where health outcomes are of interest. The EJI SER is calculated by combining rankings from only the Social Vulnerability and Environmental Burden modules and excluding rankings from the Health Vulnerability Module.
The Social-Environmental Ranking can still be used alongside the Health Vulnerability Module High Prevalence Flags to provide an overview of how specific health outcomes may be related to distributive and procedural environmental justice. For more information on the Social-Environmental Ranking and how it differs from the overall EJI, please see the EJI Technical Documentation.
Can the EJI rankings be used in secondary analysis? Are there any considerations when doing this?
The EJI represents cumulative impacts of environmental burdens on human health and well-being and has a broad range of applications for public health policy. However, the pre-existing health condition indicators within the Health Vulnerability Module are not intended for use in research and secondary analysis.
The EJI SER was specifically designed for use in secondary analysis in cases where health outcomes are of interest. For example, an exploratory analysis into correlations between asthma prevalence and the EJI would not be able to use the full overall EJI score, because estimates for asthma prevalence are already included in the Health Vulnerability Module. However, as the EJI SER does not include estimates for asthma prevalence, it can be used for this analysis.
How do I use the disease prevalence flags with the EJI Social-Environmental Ranking?
Disease prevalence flags indicate that an area has high estimated prevalence of individual diseases. High estimated prevalence is defined as the top 33.33% of all U.S. census tracts for an individual disease.
Flags can be used alongside the EJI Social-Environmental Ranking to indicate if areas with high levels of disease burden also experience high levels of environmental burdens and social vulnerability.
For example, if a user is interested in seeing how asthma rates compare to the cumulative impacts of environmental and social factors for a given community, they can overlay asthma flags on a Social-Environmental Ranking map to see where environmental burden, social vulnerability, and asthma rates align. More information on disease prevalence flags can be found in the EJI Technical Documentation.
Select limitations of the EJI
The EJI is intended as a high-level mapping and screening tool that characterizes cumulative impacts and patterns of environmental injustice across the United States. The tool relies on historical data generated by various institutions on varying time scales.
The EJI is not intended as:
- A definitive tool for labeling environmental justice communities,
- A tool for characterizing all environmental justice issues,
- A comprehensive representation of current or future social, environmental, or health characteristics,
- A representation of risk or exposure for a community, or
- A tool to tell whether individuals are at risk.
Detailed information on the limitations of the EJI can be found in the EJI Technical Documentation.
More information
Contact
For more information, contact the EJI Coordinator at eji_coordinator@cdc.gov.
Media inquiries may be sent to placeandhealth@cdc.gov.

